From 31.5. to 2.6.2022, the 8th German Library Congress took place in Leipzig, one of the most important trade fair events in the German library sector. Under the motto #CreatingFreeSpaces, a lively exchange of institutions, companies and educational institutions took place. The openCost team was also involved and was able to present the DFG project to a larger audience for the first time.
In the public Hands-on Lab “Strategy to capture the ‘Total Cost of Publishing'”, all seats were completely filled with 64 participants. After a round of welcoming and some introductory words, Dr. Bernhard Mittermaier (FZ Jülich) devoted a short presentation to the topic of “Information Budget”. Therfore, he provided important introductory impulses for the workshop. The participants showed great interest in the project and subsequently had a lively exchange with the moderators Bianca Schweighofer (UB Regensburg) and Dr. Martin Köhler (DESY) about the necessary data for complete transparency of payments to publication bodies.
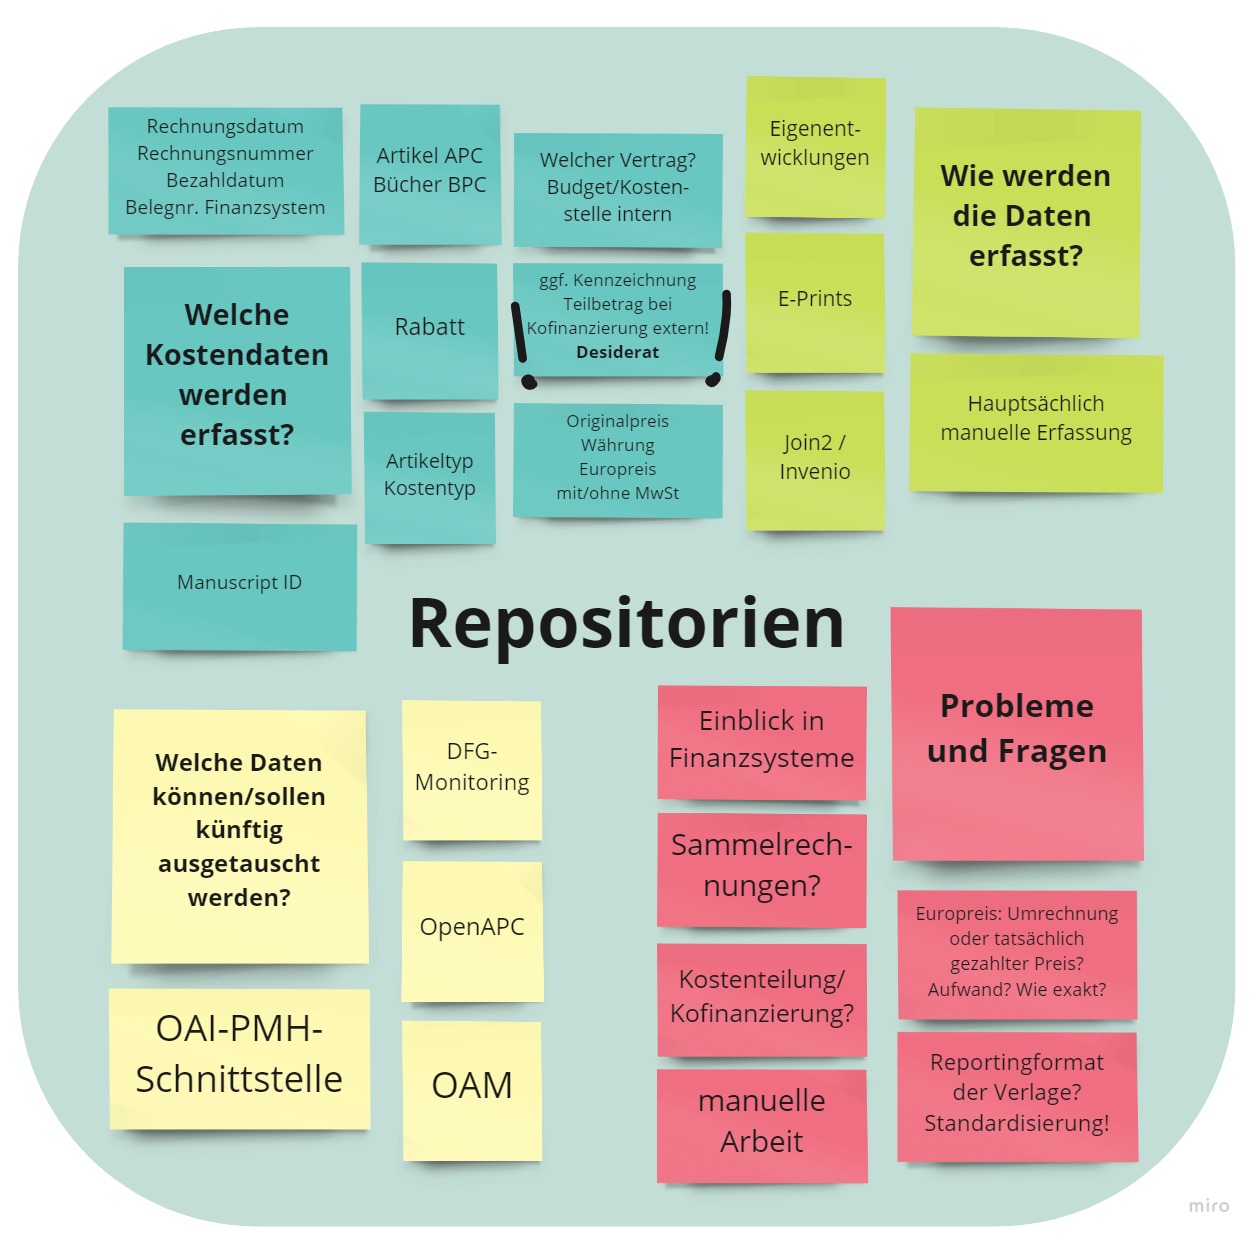
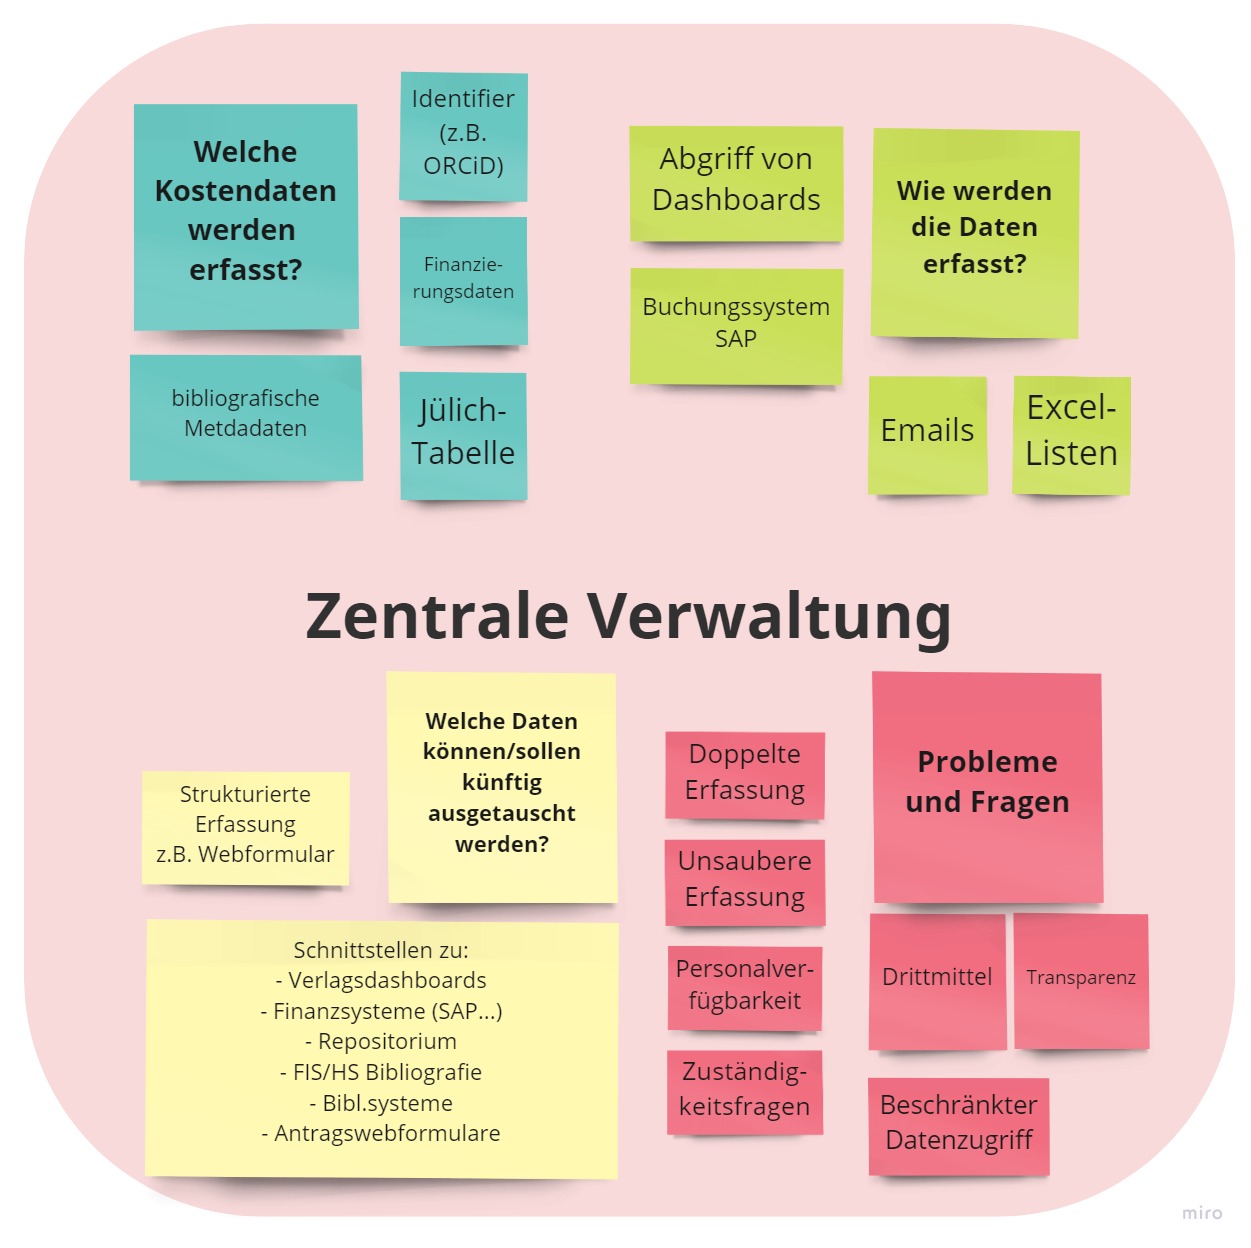
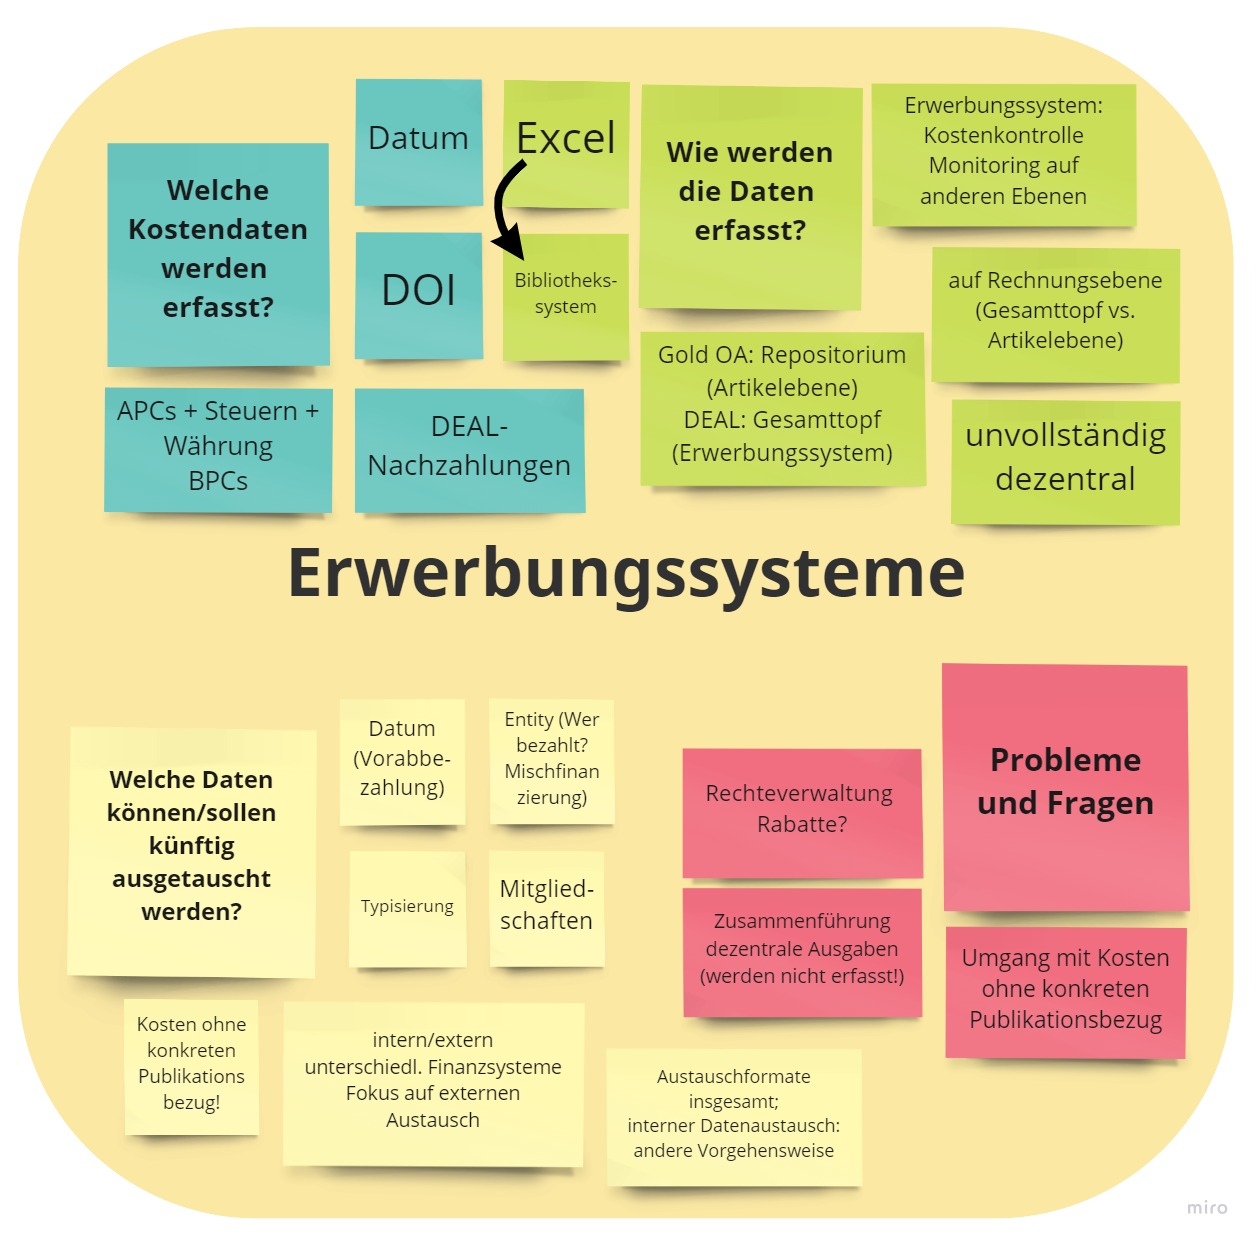
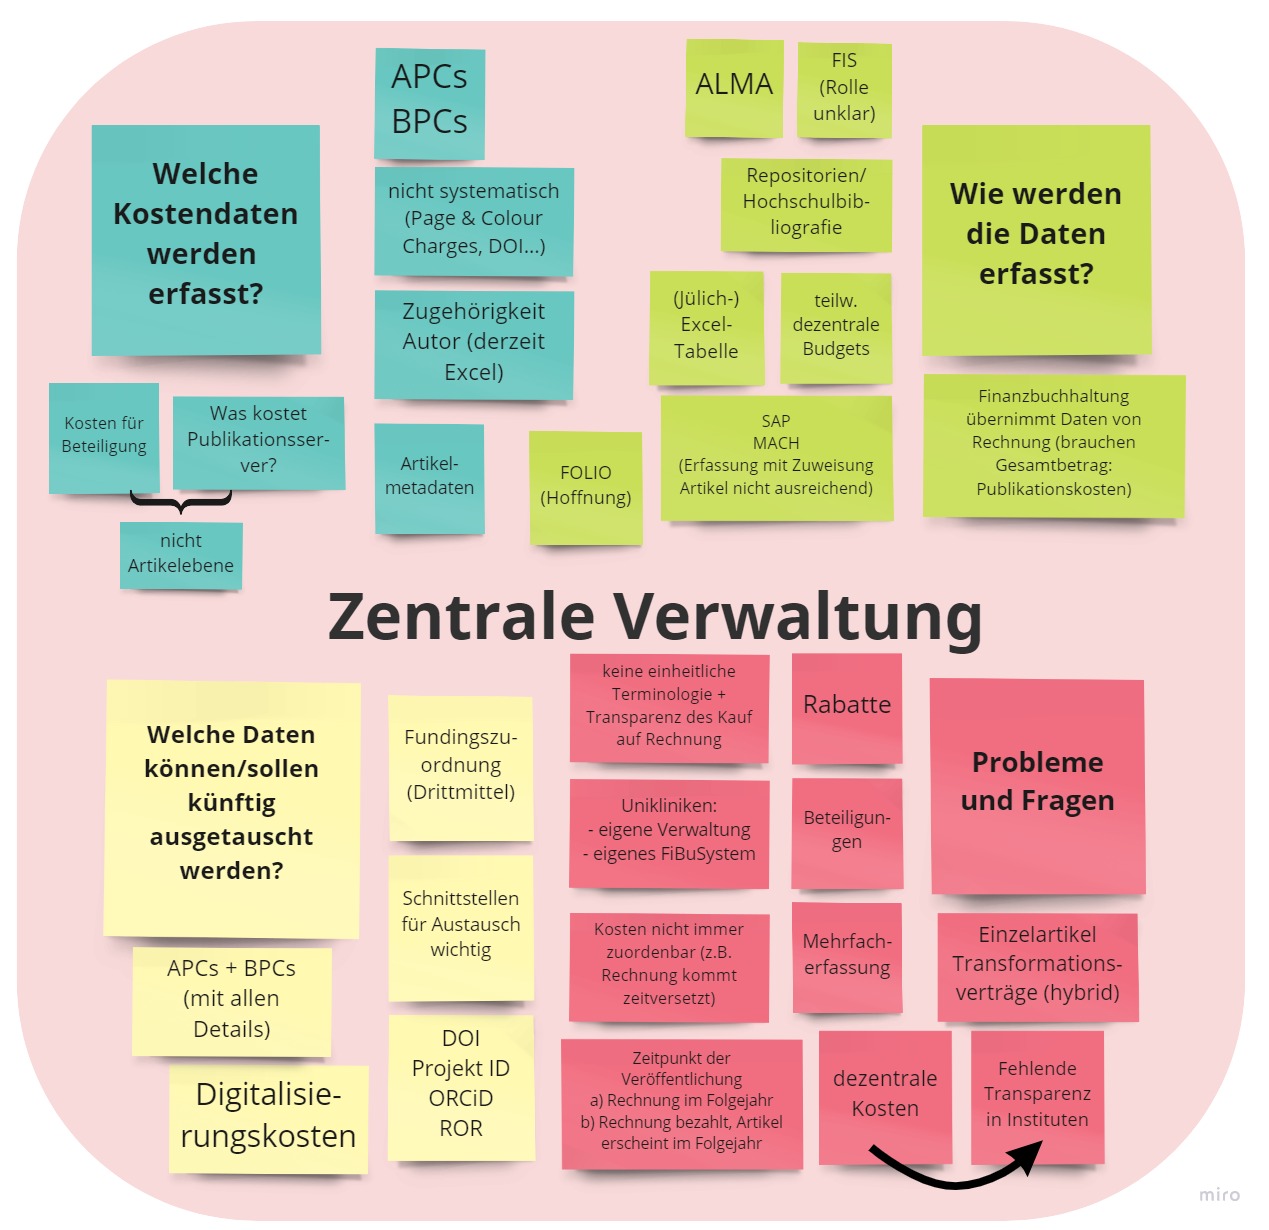
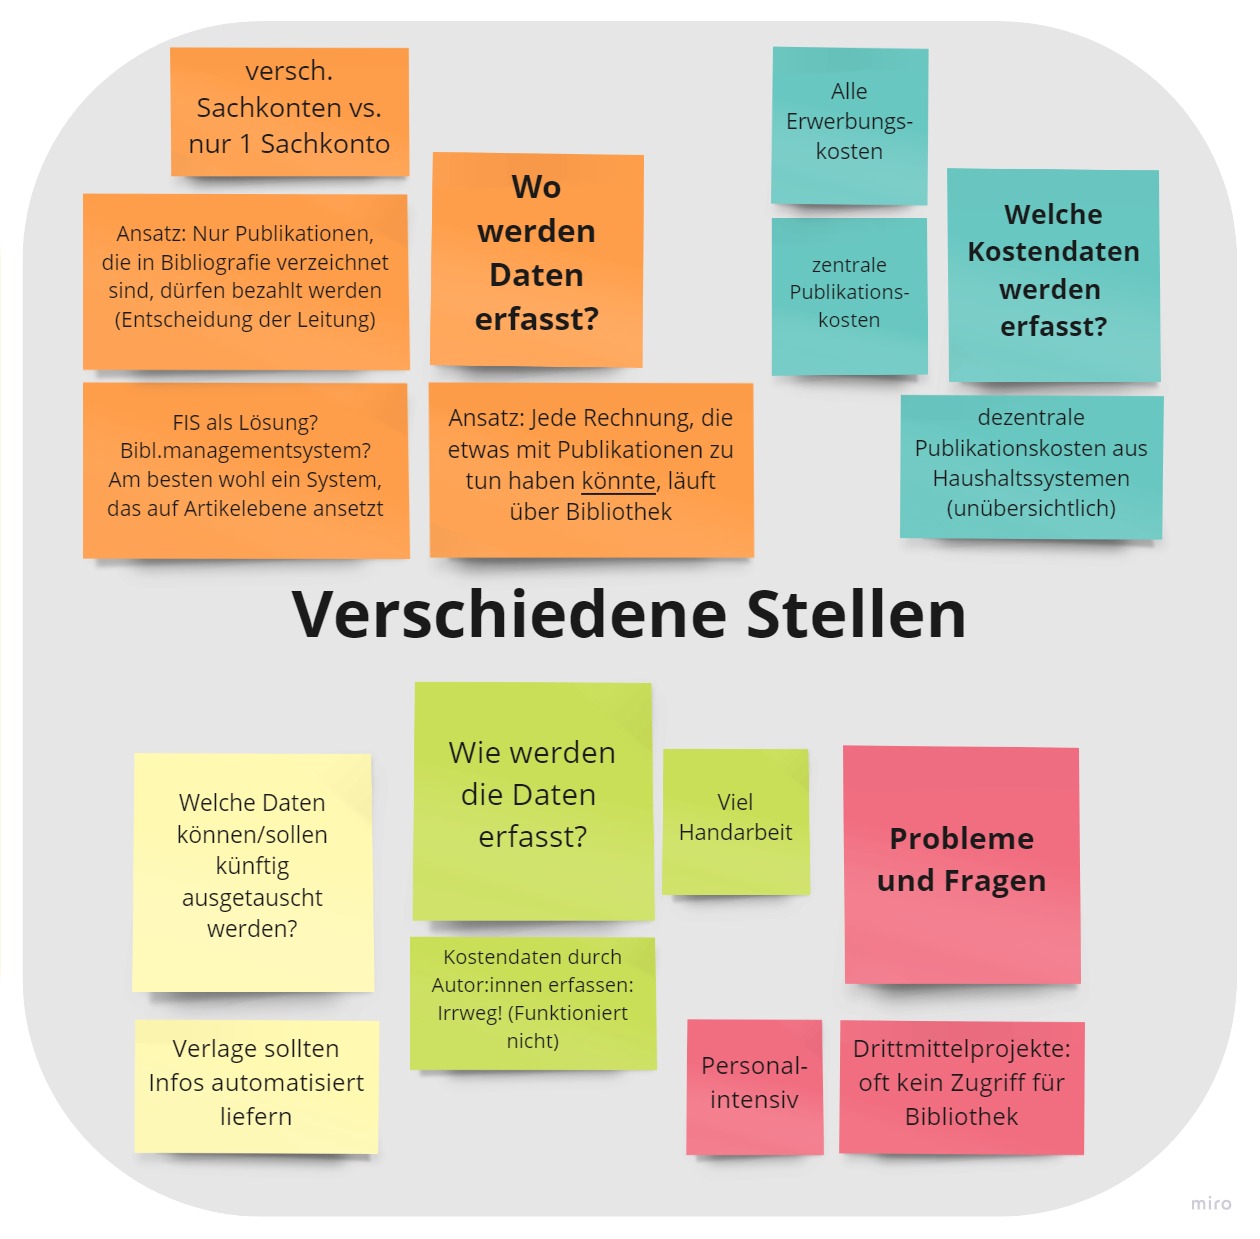
Results of the group work on cost recording
In addition to presenting the project, the Hands-on Lab also served as a joint exchange of information and ideas with the community. In five small groups, the attendees worked on the following questions and topics:
- What cost data do you currently collect?
- How do you record this data?
- What data can and should be shared in the future?
- Problems and questions in connection with cost recording
It became apparent that a lot of cost data is already being recorded, but mostly in different systems, formats, and not in a structured way. For example, some institutions record their publication costs in the institutional repository, others in the acquisition system or in central administration. However, most participants reported decentralized recording of cost data in various places, with decentralized expenditures sometimes not recorded. Many fall back on the tried and tested Excel lists. In-house developments, EPrints, JOIN2 and Invenio, accounting systems such as MACH and SAP, and library systems such as ALMA are also used. Tapping cost data from publisher dashboards is also common.
The participants agreed that it is not possible for authors to record publication costs themselves. Furthermore, they mentioned the handling of costs without a concrete publication reference or discounts as a recurring problem. In addition, costs cannot always be clearly assigned and are sometimes recorded twice or inaccurately. Further problems are the handling of cost sharing or co-financing by other institutions as well as the funding allocation for third-party funded projects. Some of those present also criticized the lack of transparency and the lack of uniform terminology. In addition, cost recording involves a lot of manual work due to the manual entry of data and is therefore very labor intensive.
Discussion and exchange of ideas
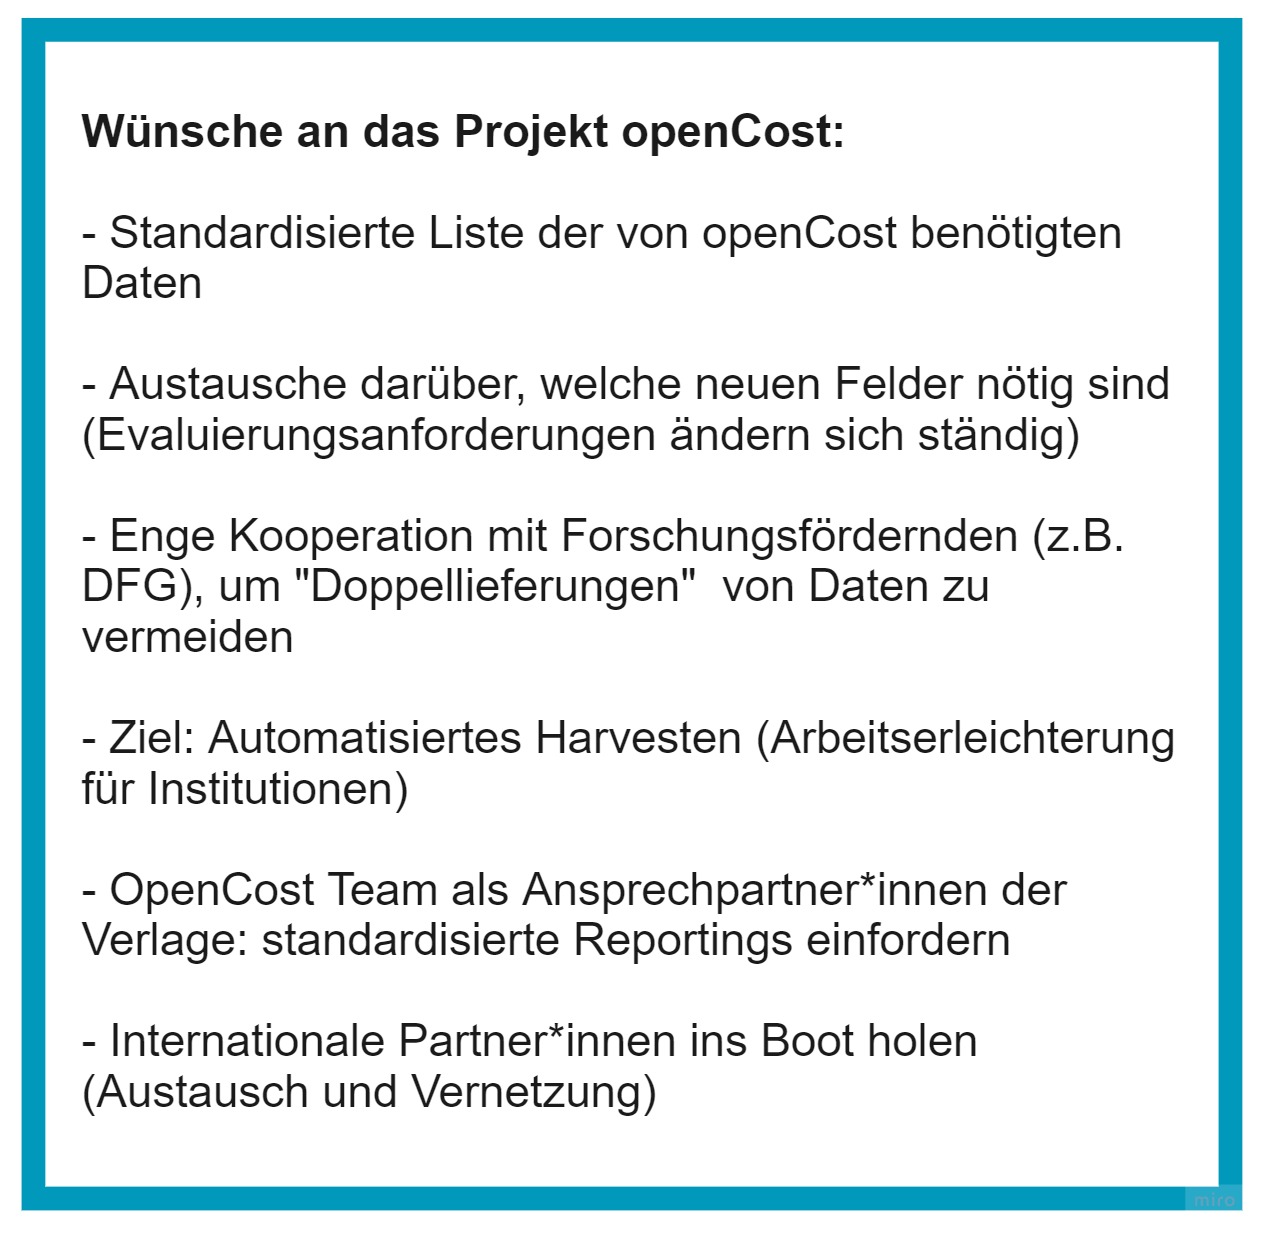
Following the group work, those present expressed wishes for the openCost project in an open discussion round. For example, a standardized list of the data sets required by openCost was requested to facilitate the work of the institutions. Also the automated harvesting of cost data via the established OAI-PMH interface envisaged by the project was rated very positively by the participants. The importance of interfaces, for example to repositories, financial systems as well as publisher dashboards, was already mentioned by them earlier in the small groups.
The project plan to enter into an exchange with international partners also met with general approval. Here, the participants mentioned corresponding projects in Austria, for example. Furthermore, they suggested a close cooperation with research funding agencies such as the DFG in order to avoid a “double delivery” of data. Since evaluation requirements are constantly changing, a regular exchange on required new fields was also recommended. In addition, those present expressed the wish for the openCost team to act as a contact for publishers and to demand standardized reporting from them.
The results from the small groups can be seen here visualized in the Miroboard: